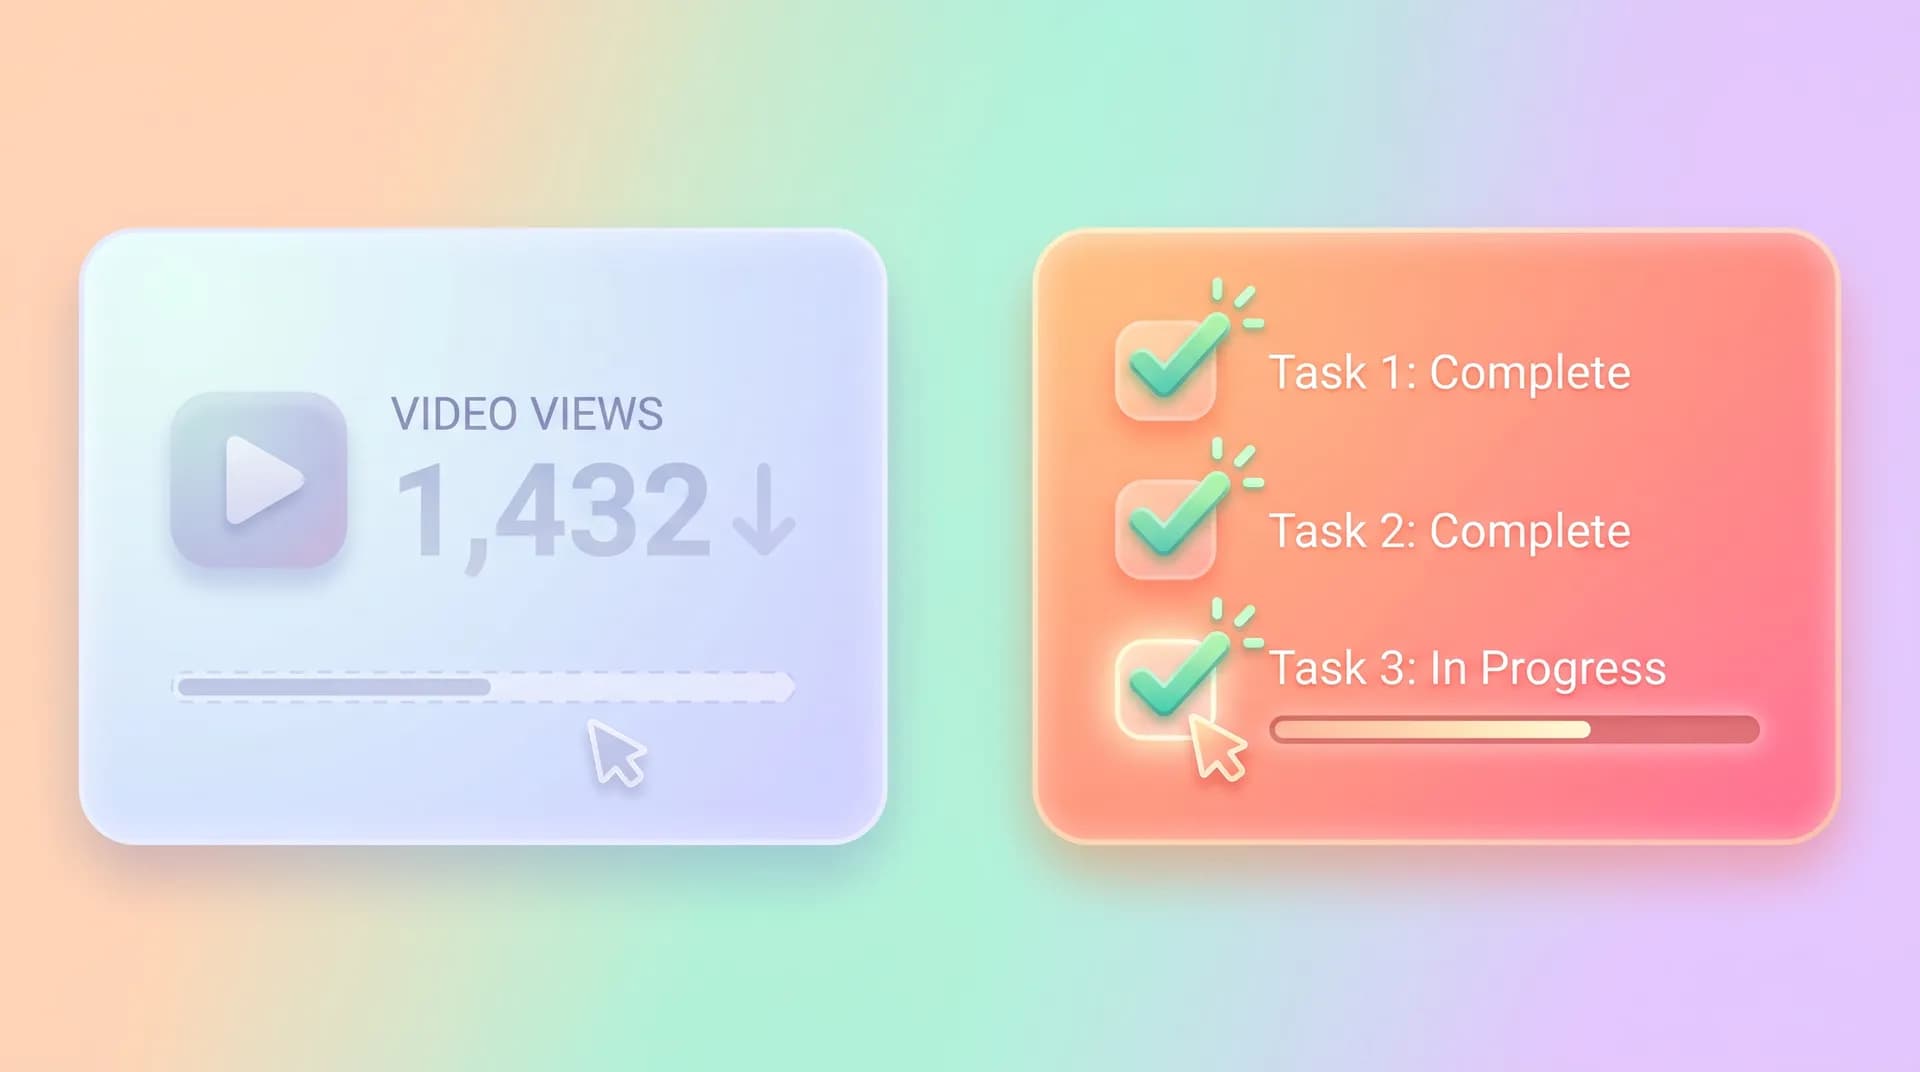
Saas Onboarding Activation Metrics: Stop Counting Views
Saas onboarding activation metrics should track completed tasks, not plays. Here's why view count and watch time lie to you about activation.

Here's a number that should bother you: a SaaS team I talked to last quarter had a 68% completion rate on their onboarding video. Leadership was thrilled. Three weeks later, their activation rate hadn't moved a single point. Nobody had connected the dots between "people watched the video" and "people did the thing the video was supposed to get them to do."
That's the trap. Saas onboarding activation metrics built around views, plays, or watch time measure attention, not outcomes. And attention is cheap. I've watched teams celebrate a 90% video completion rate while their trial-to-paid conversion sat flat for two straight quarters. The video was doing its job as content. It was failing at its actual job, which was getting users to take an action that predicts retention.
Why saas onboarding activation metrics built on views mislead you
Video view count tells you one thing: someone pressed play and didn't close the tab immediately. That's it. It doesn't tell you whether they understood the feature, whether they trusted it enough to try it, or whether they even watched with sound on while doing something else in another tab.
Watch time is a slightly better signal but still fundamentally about consumption, not application. I've seen onboarding videos with gorgeous 85% average watch-through rates sit next to activation funnels where fewer than 1 in 5 of those same viewers ever completed the task the video demonstrated. The video was watchable. It wasn't actionable.
Part of the problem is that view-based metrics are easy to pull from any video host — Wistia, Loom, YouTube, whatever you're using — so teams default to them. They're the metrics that show up automatically in a dashboard without extra engineering work. That convenience bias is doing real damage to how product and marketing teams evaluate onboarding content.
Compare that to task completion. If your video shows a user how to connect their first data source, the only metric that matters is: did they connect a data source within, say, 10 minutes of the video ending? Everything else — plays, scroll depth, time-on-page — is noise dressed up as signal.
The correlation gap nobody talks about
Video views and product activation aren't just imperfect proxies for each other — in a lot of cases they barely correlate at all. A user can watch your entire 90-second product tour, nod along, and then bounce because the actual UI they land on doesn't match what they just saw, or because the first step has friction the video glossed over.
I'd argue this is actually the more common failure mode than people not watching at all. The video succeeds as media. The product experience right after it fails as execution. If you're only tracking views, you'll never catch that gap because your metric stops measuring the moment the video ends — right when the part that actually matters begins.
This is exactly the argument I make in our pillar piece on SaaS onboarding videos and user activation: the video is a means, not the end. Treating it as the finish line is how teams end up optimizing the wrong layer of the funnel entirely.
What to track instead: completed actions as your north star
Pick one task per onboarding video. Not three, not "general product familiarity" — one specific, observable action. Connected a tool. Invited a teammate. Created their first project. Sent their first message. Whatever the single highest-leverage task is for that stage of the journey.
Then instrument it properly:
- Time-to-completion from video end. Not from signup, from video end. You want to know if the content itself closes the gap between watching and doing.
- Completion rate among viewers vs. non-viewers. This is your actual causal signal. If viewers complete the task at meaningfully higher rates than non-viewers, the video is working. If the gap is small, the video isn't doing much lifting.
- Drop-off point if the task isn't completed. Where exactly do people stall after watching? This tells you whether the video set the wrong expectation or whether the product UI has friction the video didn't account for.
This is the same underlying logic I cover in picking one milestone for your first useful outcome — you can't measure activation meaningfully until you've defined the one outcome that counts. Views give you zero help with that definition because they're outcome-agnostic by design.
If you're seeing a big gap between video engagement and task completion, it's worth running the diagnostic work in finding the exact stall point in your onboarding drop-off before you touch the video at all. Sometimes the fix isn't a better video — it's removing a confusing step the video is accidentally covering for.

Building the measurement pipeline
You need event tracking that ties video completion to the specific in-product action, and most teams don't have this wired up by default. Your video host tells you about plays. Your product analytics tool (Amplitude, Mixpanel, PostHog, whatever you're running) tells you about actions. Nobody tells you the two happened in sequence for the same user unless you build that join yourself.
Practically, this means:
- Tag the video event with a user ID and timestamp.
- Tag the target action event the same way.
- Build a funnel or cohort view that shows: viewed video → completed action within X minutes/hours → still active at day 7/30.
That third step is the one people skip, and it's the one that actually proves the video drove retention rather than just correlating with users who were already going to succeed. I've seen teams run this analysis and discover their "high-performing" onboarding video was mostly watched by power users who'd have activated anyway. The video wasn't causing anything. It was just present.
Don't trust a single cohort snapshot. Run the viewed-vs-not-viewed completion comparison across at least 3-4 weeks of signups before you draw conclusions — early adopters and late-stage trial users behave differently enough to skew a one-week sample.
Tools like Amplitude and Mixpanel make this joinable work manageable if you're already piping video events into the same pipeline as product events. If you're not, even a lightweight approach — tagging video completion as a custom event inside PostHog or your CRM — beats relying on your video host's native dashboard alone.
Where this connects to format choices
Once you're measuring completions instead of views, you'll often find certain video formats outperform others on the metric that matters even if they underperform on raw watch time. A tightly scoped, single-task video frequently drives higher completion rates than a longer, more polished tour — even though the polished version racks up better average watch time. That's a direct argument for the approach laid out in scripting a single-task onboarding video people actually watch: narrower scope, better activation, worse-looking vanity metrics. Choose activation.
It's also why the debate over onboarding video vs. interactive product walkthrough shouldn't be settled by which one gets more plays. It should be settled by which one gets more completed actions per user who starts it.
If you only change one thing after reading this: rename your onboarding dashboard's primary metric from "video completion rate" to "task completion rate (post-video)." The semantic shift alone tends to change what teams optimize for next sprint.
The business case for completion over views
This isn't just a measurement purity argument — it has real downstream cost. Teams that optimize for view count end up investing in things that boost views: better thumbnails, catchier intros, shorter runtimes to juice completion percentage. None of that moves activation if the underlying task still has friction.
Meanwhile, teams that optimize for completed actions end up investing in things that actually matter: clearer instructions, better-timed CTAs after the video, tighter alignment between what's shown and what's clickable next. According to research from Gainsight on product-led growth benchmarks, activation-stage friction is one of the top three predictors of early churn — and that's not something a view counter will ever surface for you.
ProfitWell's analysis of churn drivers makes a similar point: the moment a user fails to reach early value is far more predictive of cancellation than how much content they consumed getting there. Attention isn't the bottleneck. Completion is.
Counter-intuitive but true: lowering your video's play rate while raising its post-video task completion rate is a win. Fewer, more qualified viewers reaching the action beats more viewers stalling after the credits roll.