
UGC marketing ROI: metrics and reporting guide
Learn how to track UGC-specific KPIs like thumb-stop rate, hook rate, and ROAS by creative type — and build reports that prove UGC's value to stakeholders.

My creative team once ran 14 UGC videos simultaneously on Meta. The ads team loved them. The CFO asked one question at the next budget review: "What did we actually get for that spend?" Nobody had a clean answer. Not the media buyer, not the brand manager, not the agency. That moment — watching smart people stare at spreadsheets — is why I became obsessed with UGC marketing ROI.
The problem isn't that UGC doesn't perform. It does, often dramatically. The problem is that most brands measure it with the wrong metrics, pull the wrong reports, and then wonder why leadership keeps treating creator content like a "nice to have" instead of a performance channel.
That changes here.
Why standard ROI metrics miss what UGC actually does
You can't just drop a UGC campaign into your standard paid social reporting framework and call it a day. A polished brand video and a 45-second creator review video do fundamentally different things at different stages of the funnel — and if you measure them the same way, you'll consistently undervalue UGC.
Here's the core issue: UGC works in layers. It stops scrollers, builds trust, drives consideration, and converts — sometimes all in one video, sometimes across multiple touchpoints. Generic campaign metrics like "impressions" or "clicks" capture almost none of that nuance. You need UGC-specific KPIs that tell the story of why a creative worked, not just whether it spent your budget.
Our broader UGC marketing guide for brands covers the strategic foundation. This article is about the measurement layer — the specific numbers you need to track and how to structure them into reports that actually change decisions.
The four metric buckets that matter
Think of UGC performance in four distinct layers:
1. Hook metrics — Did the creative earn attention in the first 1-3 seconds? 2. Engagement metrics — Did viewers keep watching and interact? 3. Conversion metrics — Did the ad drive the action you wanted? 4. Efficiency metrics — Did it deliver that action at a profitable cost?
Every UGC asset you run should be scored across all four. Not just conversions. Not just ROAS. All four.
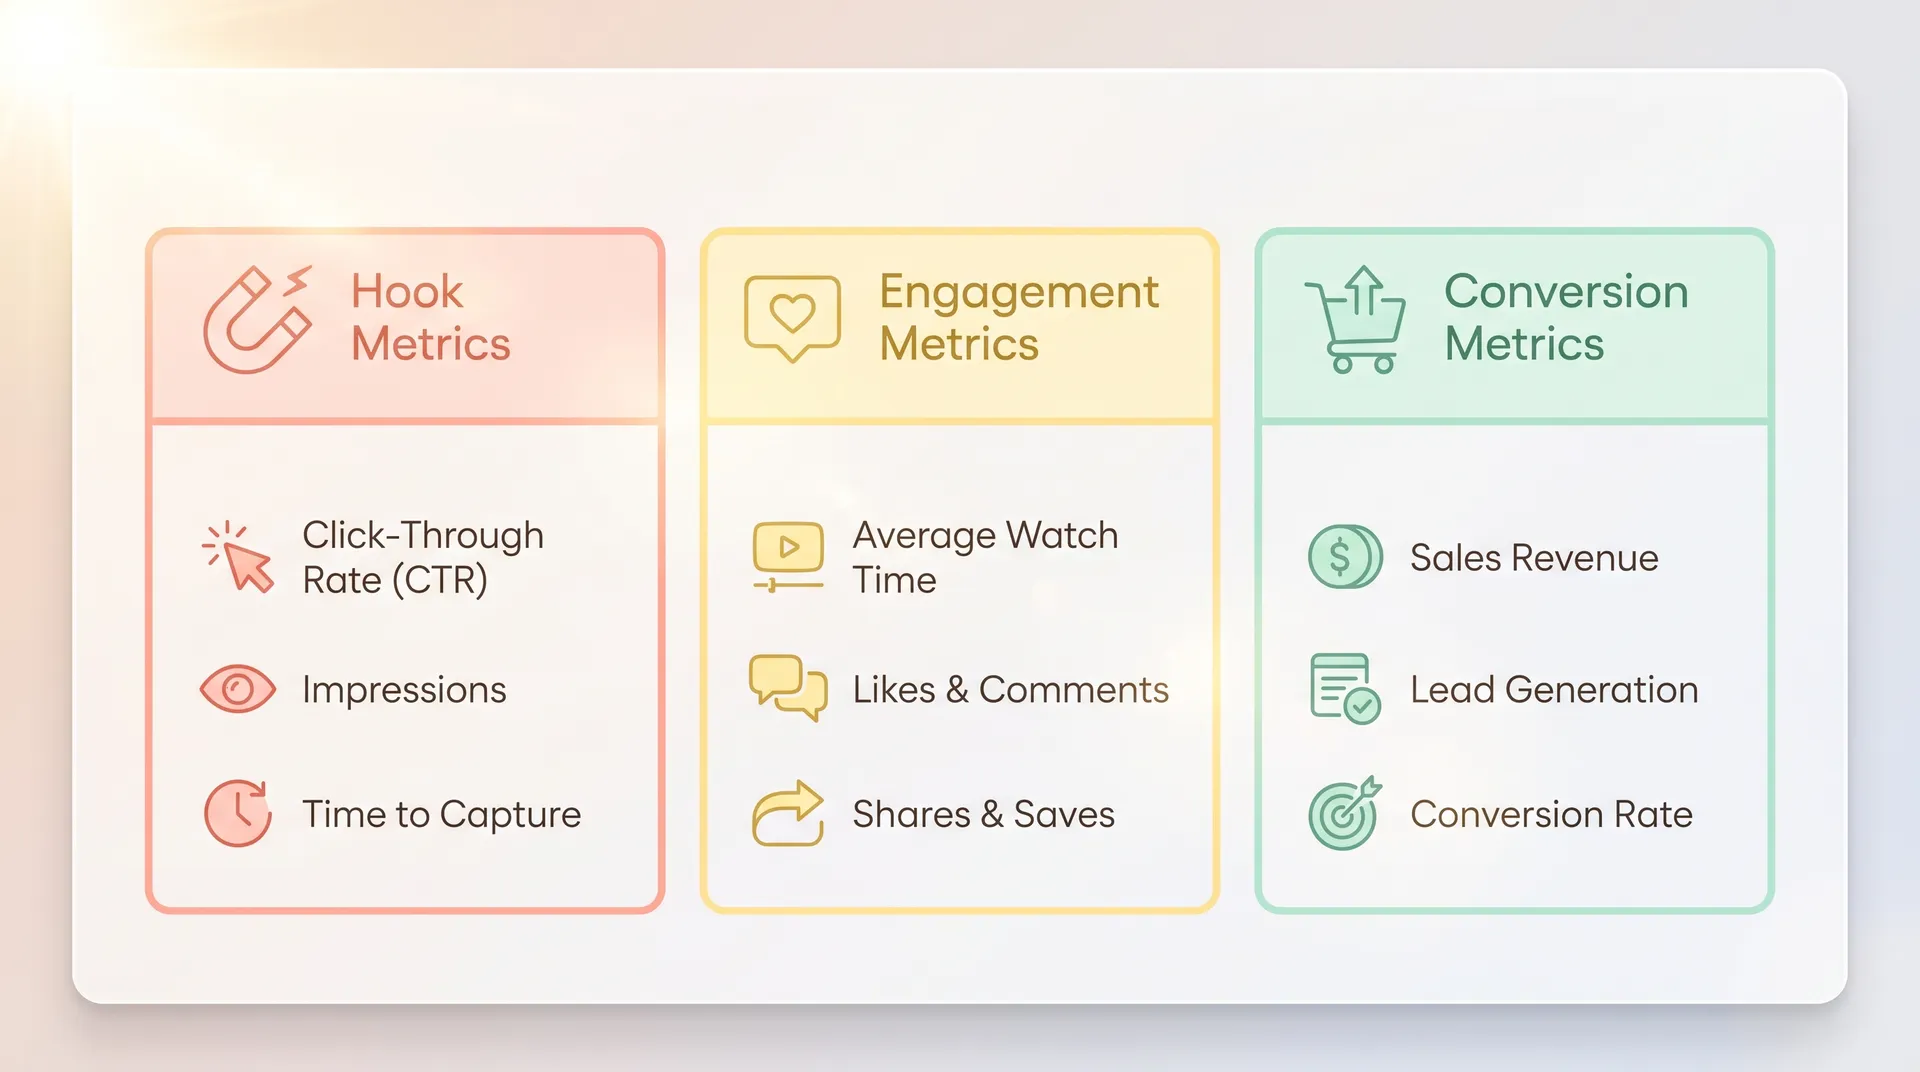
The UGC-specific KPIs you should be tracking
Thumb-stop rate
Thumb-stop rate (also called scroll-stop rate) measures what percentage of people who saw your ad actually stopped scrolling to watch it. The formula: impressions ÷ 3-second video views × 100.
A strong thumb-stop rate for UGC on Meta sits around 30–40%. Below 25% and your hook has a serious problem. The hook — the opening frame, the first line of audio, the visual setup — is doing all the work here, and this metric tells you if it's working.
This is the single best diagnostic for creative quality at the awareness stage. If your thumb-stop rate tanks, no amount of spend will save the campaign.
Hook rate
Hook rate (sometimes called view-through rate to 3 seconds) overlaps with thumb-stop but focuses specifically on intent to watch. The real benchmark you want is 3-second view rate vs. 15-second view rate. If someone watches 3 seconds but bails before 15, your hook got them but your story didn't hold. That's a scriptwriting problem, not a targeting problem.
We've seen UGC videos with incredible 3-second rates — curiosity hooks, bold claims, pattern interrupts — that still flopped because seconds 4 through 12 went nowhere. Testing hook variations systematically is the fastest way to improve this metric across your entire creative portfolio.
Cost per result (CPR)
CPR is your bread-and-butter conversion metric — the cost per purchase, sign-up, or lead that the creative directly drove. Where UGC typically shines is that CPR runs 20–40% lower than polished brand ads on comparable audiences, according to data from Meta's own creative research.
Track CPR by creative type: raw creator footage vs. creator + branded end card vs. creator testimonial vs. creator demo. You'll find that different formats win at different funnel stages, and without that breakdown you're flying blind on what to produce next.
ROAS by creative type
Return on ad spend by creative type is arguably the most important metric for justifying your UGC budget to leadership. Not blended ROAS across all creative — ROAS broken down by:
- Creator testimonial videos
- Product demo/unboxing
- Problem-solution narrative
- Social proof compilations
- Hook style (question hook vs. bold claim vs. pattern interrupt)
Facebook Ads Manager lets you add a custom "creative name" label to every ad so you can pull this breakdown without manual gymnastics. TikTok Ads Manager has similar functionality. Do this from day one on every campaign — retrofitting it later is painful.
A benchmark to aim for: UGC should consistently deliver 2–4× ROAS on cold audiences in DTC e-commerce. If you're below that, the issue is usually creative quality or audience mismatch, not UGC as a format.
Video completion rate (VCR)
VCR — the percentage of viewers who watched your video to 75% or 100% — tells you about hold power. High VCR on a short video (under 30 seconds) means the script and delivery kept people engaged. High VCR on a longer video (60–90 seconds) is genuinely exceptional and usually signals a deeply resonant message.
Pair VCR with CPR. A video with high VCR but mediocre CPR often has a CTA problem — great story, weak close. A video with low VCR but solid CPR usually has a strong opening hook with a quick product reveal that converts impulsive buyers.
Building a reporting framework that proves incremental value
Tracking the right metrics is step one. Structuring them into a report that persuades stakeholders is a different skill entirely.
The weekly creative scorecard
For active campaigns, I recommend a simple weekly scorecard with six columns per creative asset:
| Creative | Spend | Thumb-Stop | 3s–15s Hold | CPR | ROAS |
|---|---|---|---|---|---|
| Creator A – Demo | $4,200 | 38% | 71% | $18.40 | 3.2× |
| Creator B – Testimonial | $3,800 | 29% | 58% | $22.10 | 2.6× |
| UGC Compilation | $2,100 | 44% | 63% | $19.80 | 3.0× |
This format does two things: it tells you which creatives to scale, and it tells you why each is performing or not. Leadership can see the story at a glance without needing to understand the nuances of paid media.
Your UGC ad creative testing process should feed directly into this scorecard. Every test produces a winner — and every winner's metrics go into the scorecard as a baseline benchmark.
The monthly stakeholder report
Monthly reports need to answer one question for leadership: is UGC delivering better returns than our alternatives? That means you need a side-by-side comparison:
- UGC creatives vs. brand studio creatives: CPR, ROAS, VCR
- UGC creatives vs. influencer posts used as dark ads: CPR, ROAS, engagement rate
- UGC spend vs. influencer marketing spend: cost per quality view, cost per conversion
Include a "creative lifespan" metric too. UGC typically fatigues faster than polished ads (sometimes within 2–3 weeks on heavy spend), but it's also cheaper to produce. Showing the cost-per-winning-creative over time makes the economic case for maintaining a consistent UGC pipeline.
A good monthly report doesn't just show what happened — it recommends what happens next. "Creator testimonials outperformed demos by 28% on CPR this month. We recommend shifting 60% of next month's creative budget to testimonial-format UGC from 4–6 creators." That's how you turn a metric into a decision.
Isolating UGC's incremental contribution
This is where most brands get stuck: how do you separate UGC's contribution from everything else happening in the marketing mix?
Three practical approaches:
1. Creative-isolated A/B tests. Same audience, same budget, same dates — swap only the creative. One cell runs UGC, one runs polished brand video. The performance delta is UGC's incremental contribution. Meta and TikTok both support this through their native A/B testing tools.
2. Holdout tests. Run UGC-heavy campaigns in specific geographic markets while holding creative constant elsewhere. Compare conversion rates across markets over the same period. This is more work but gives you cleaner attribution.
3. Post-purchase surveys. Tools like KnoCommerce let you ask customers "how did you first hear about us?" Adding a "saw a creator/review video" option consistently reveals UGC's touchpoint influence that last-click attribution completely misses.
The last-click attribution model, by the way, is the single biggest reason brands underestimate UGC's value. Creator content often works at the awareness and consideration stages — it primes the purchase even when it doesn't close it. If you're only looking at last-click ROAS, you're seeing maybe 60% of the picture.
Setting up your UGC reporting stack
You don't need expensive software to do this well. Here's what I'd actually use:
- Meta Ads Manager — Pull creative-level breakdowns with custom naming conventions. Export to CSV weekly.
- TikTok Ads Manager — Same approach. Don't ignore the "creative insights" tab — it's genuinely useful.
- Google Looker Studio (free) — Connect your ad account data and build a live dashboard that your team can check without logging into ad platforms.
- A simple Notion or Google Sheets scorecard — For the weekly creative review meeting. Sometimes the most useful tool is the least fancy one.
If you're running UGC through a creator platform, many of them now offer built-in analytics. Check what's available — it could save you hours of manual reporting.
One practical tip: name every creative asset consistently before it goes into the ad platform. A naming convention like [format]-[creator]-[hook-type]-[date] (e.g., testimonial-jess-bold-claim-0625) makes it trivially easy to filter and compare in reports. It sounds tedious. Not doing it is worse.
What good UGC marketing ROI actually looks like
Let me give you some real benchmarks to work from. These are averages — your category, price point, and audience will shift them — but they're a grounded starting point:
- Thumb-stop rate: 30–40% is strong; under 25% is a problem
- 3s–15s hold rate: 60%+ means your story is working
- CPR vs. brand creative: Expect UGC to beat polished ads by 15–35% on cold audiences
- ROAS (DTC e-commerce): 2.5–4× is the range where UGC earns its place in the budget
- Creative lifespan: Plan for 2–4 weeks before fatigue on high-spend campaigns; refresh at 1.5× frequency
These numbers come from real campaign data, and research from Nielsen showing that 88% of consumers trust recommendations from people they know more than traditional advertising — that trust advantage is ultimately what the performance data is capturing.
Don't benchmark your UGC against last quarter's brand video spend alone. Benchmark it against the alternative use of the same dollars. If $5,000 in UGC production gets you better ROAS than $5,000 in studio shoots, that's the real ROI story worth telling in your next budget review.
FAQ
Frequently Asked Questions
What is a good ROAS for UGC ads?
How do I measure UGC marketing ROI without a big analytics team?
What is thumb-stop rate and how do I calculate it?
How long does it take to see ROI from UGC content?
Why does UGC often underperform in last-click attribution?
How many UGC creatives do I need to test before drawing conclusions?
Related reading
- UGC marketing: the brand's complete guide (2025)
- UGC ad creative testing: how to find winners fast
- UGC vs. influencer marketing: which should your brand budget?
- UGC marketing budget: how much brands should spend
- How to write a UGC campaign brief that works
- Creative brief examples for UGC hook A/B testing