App Retention Cohort Analysis by Creative Source
Learn how to run app retention cohort analysis by creator and creative source to spot quality gaps ad platforms hide behind blended CPI numbers.

Two creators drove the exact same number of installs last month at nearly identical CPI. One cohort is still opening the app at day 30. The other churned almost entirely by day 7. If you're only looking at your ad platform's install and CPI numbers, you'd never know the difference — and you'd probably keep spending on the creative that's quietly wrecking your retention.
This is the blind spot nobody talks about in creator-led app marketing. Everyone obsesses over CPI and CTR. Almost nobody runs app retention cohort analysis segmented by which creator or creative actually drove the install. That's a mistake, and it's costing you money you can't see on a Meta or TikTok dashboard.
Why app retention cohort analysis by creative source matters
Ad platforms optimize for the thing they can measure fastest: clicks and installs. They have zero incentive to tell you that Creator A's hook attracts tire-kickers who bounce in 48 hours while Creator B's content — even at a slightly higher CPI — brings in users who stick around and convert to paid.
I've seen this play out directly with Flare customers. Two UGC creatives, same budget, same audience, same landing experience. Blended CPI differed by maybe 8%. Day-30 retention differed by 3x. If you'd judged purely on CPI, you'd have scaled the wrong creative into six figures of spend before noticing anything was wrong — probably not until LTV reports showed up weeks later, if you were even tracking LTV that granularly.
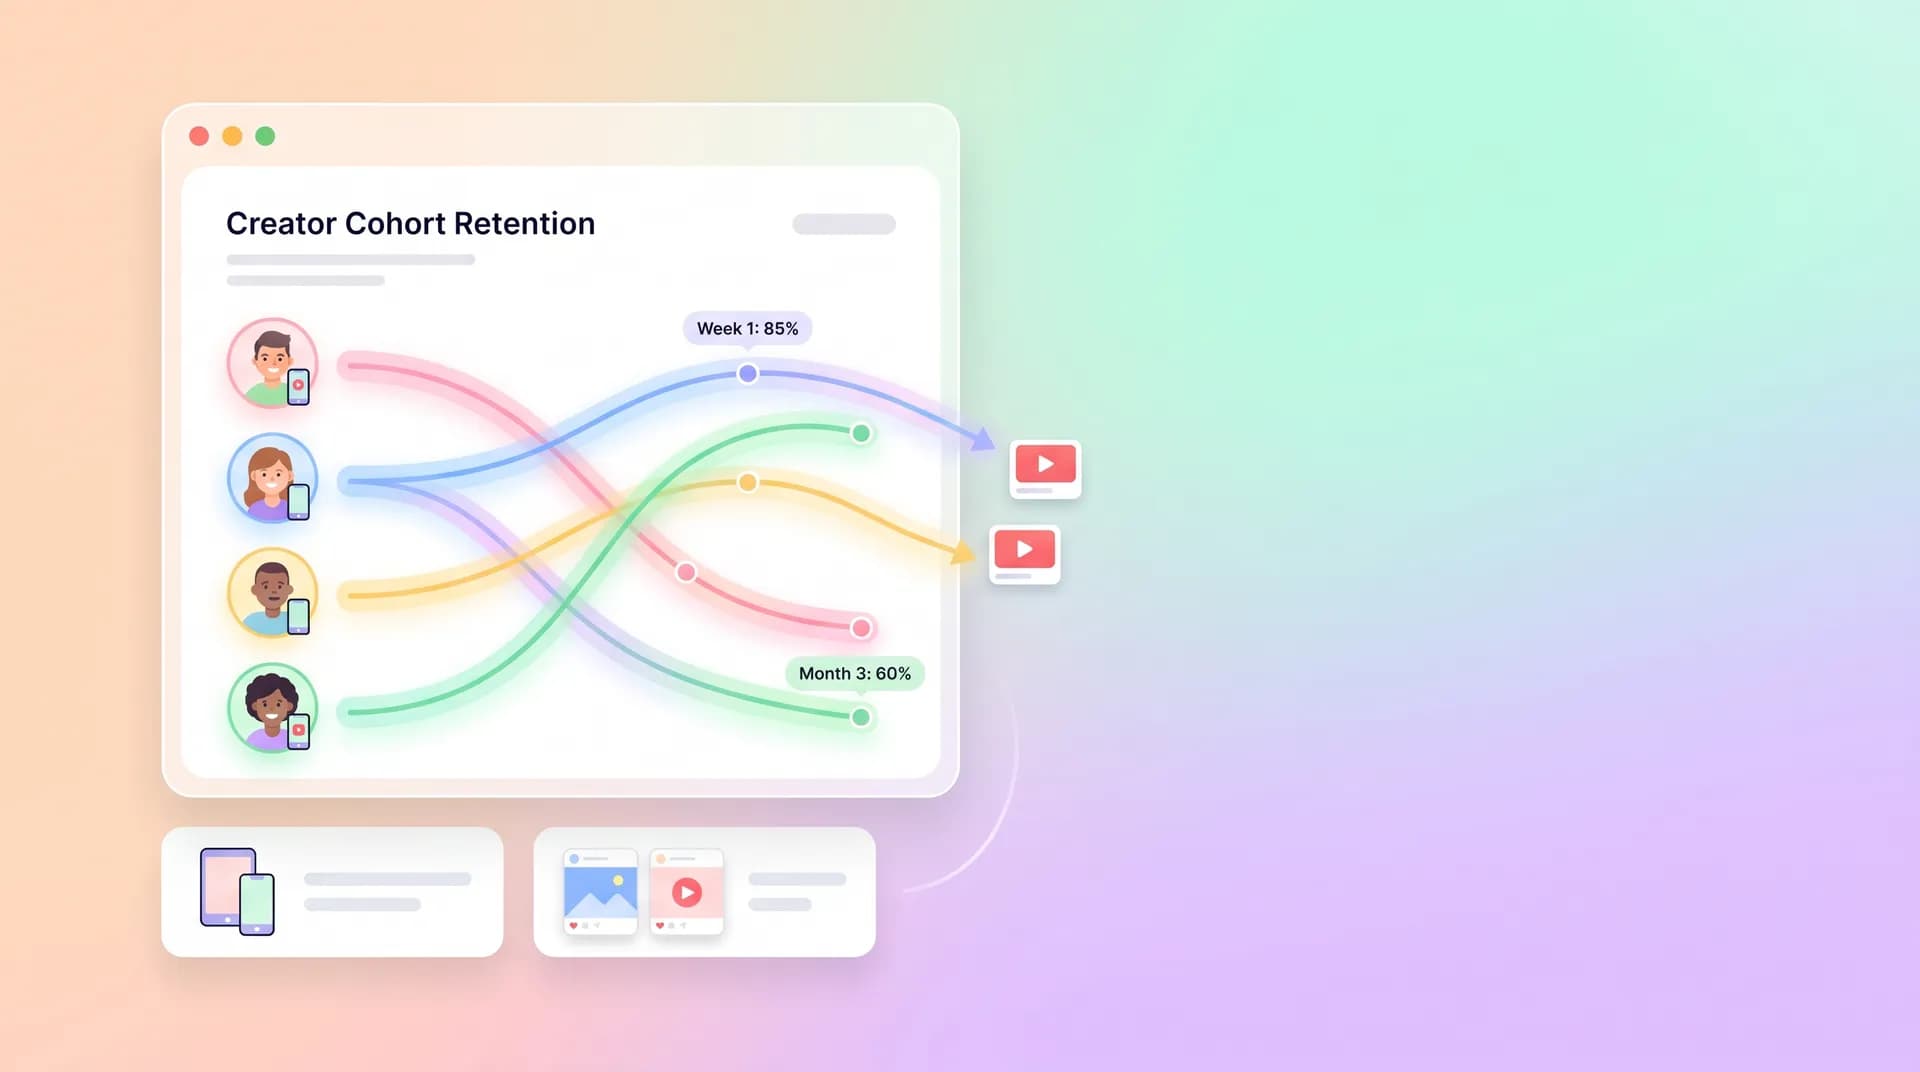
Cohort analysis fixes this by asking a different question. Instead of "how many installs did this creative get," you ask "what happens to the people this creative brought in, over time, compared to everyone else." Segment by creative source and the quality differences ad platforms hide start showing up immediately.
The metric gap platforms won't fill
Meta Ads Manager and TikTok Ads Manager report installs, cost, and sometimes in-app events if you've wired up SKAN or MMP postbacks. They do not report day-7 or day-30 retention by ad creative out of the box. Even with granular postback windows, most teams never connect creative-level attribution back to a retention curve. It sits in two different tools, owned by two different people, and nobody ever joins the data.
That's the gap you need to close. It's not complicated technically — it just requires deciding to do it.
How to build retention cohorts segmented by creator
Start with attribution data you already have. Your mobile measurement partner (Adjust, AppsFlyer, Branch) tags every install with a creative ID, campaign ID, and usually a sub-publisher or creator identifier if you're running whitelisted or Spark Ads content. That's your join key.
Here's the basic structure:
- Pull install-level data tagged by creative/creator ID, install date, and user ID (or device ID if you're pre-ATT/anonymized).
- Pull retention events from your product analytics tool (Amplitude, Mixpanel, or your own event warehouse) — specifically app-open events on day 1, day 7, and day 30 post-install.
- Join on user ID so every retained user is tied back to the creative that acquired them.
- Bucket into cohorts by install week and by creative source, then calculate retention rate as a percentage of the original cohort size.
- Plot curves, not single numbers. A cohort that holds steady at 18% from day 14 to day 30 is healthier than one that starts at 25% and is still falling.
If you're not ready to build this in a warehouse, even a spreadsheet pull with VLOOKUP between your MMP export and analytics export will get you 80% of the value. Don't let "we don't have a data pipeline" stop you from doing this manually for your top 10 creatives first.
Run this analysis monthly, not quarterly. Creator content quality shifts fast — a creator who nailed it in March can phone it in by June. Monthly cohorts catch the drift before it costs you a full quarter of wasted spend.
This same discipline matters even earlier in the funnel. Before you're comparing retention curves, you need to know whether the install itself was driven by a real problem-aware user or just a flashy hook — something I cover in App Marketing Audience Testing: Test Problems, Not Ads. Retention cohort analysis is really just the second half of that same discipline: test the problem, then prove the people you brought in actually stick.
What day-7 and day-30 retention actually reveal
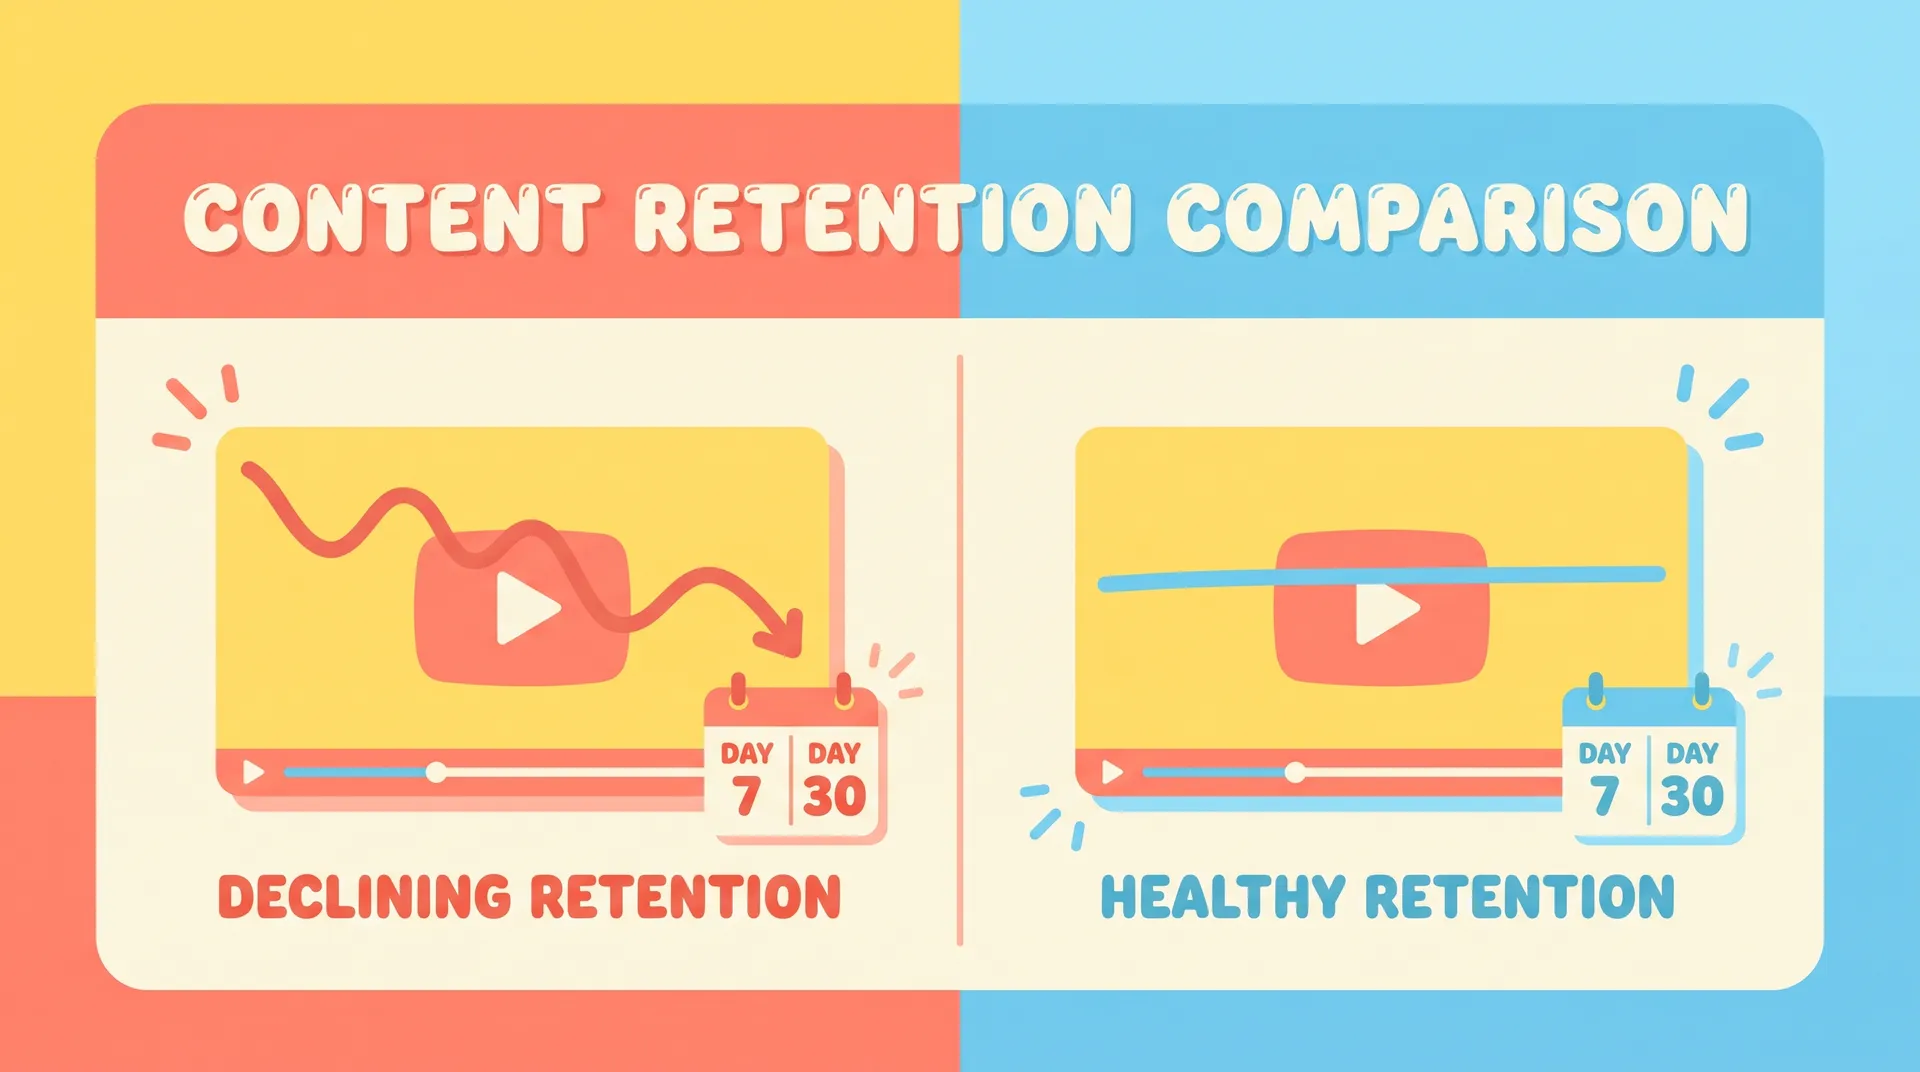
Day-7 retention tells you whether the creative set accurate expectations. If a creator oversells what the app does — "this app will literally change your life" energy on a budgeting tool — users open it once, realize it's just a budgeting tool, and leave. High install volume, terrible day-7 number.
Day-30 retention tells you something different: whether the habit formed. This is where creative quality really separates. Creators who show the app being used in a believable, specific context (not just "download now") tend to produce users who come back because they already understand what the app is for.
I'd trust day-30 numbers more than day-7 for any creative-level decision. Day-7 is noisy — lots of apps see a dip just from novelty wearing off. Day-30 is closer to a signal of real product-market fit between that specific creative's promise and the app's actual value.
Segmenting by creative angle, not just creator
Don't stop at creator-level cohorts. The same creator often tests multiple hooks, scripts, or angles. Segment by creative variant too. I've seen a single creator produce one video that retains beautifully and another that tanks — same face, same voice, different script. The creator isn't the full story; the specific promise made in the first three seconds is.
This is where pairing cohort data with your creative brief process pays off. If you brief creators with specific, outcome-focused angles (see App Benefits Video Script: Sell Outcomes, Not Features), you can map retention back to the exact promise made in the hook. That's how you figure out which specific claims attract durable users versus one-time downloaders.
Watch for the "cheap install, expensive churn" trap
Some creative consistently produces installs at a lower CPI than everything else in your account. Tempting to scale. But if day-30 retention on that cohort is half the account average, you're not actually getting cheap users — you're paying to churn people faster. Run the math on blended LTV, not blended CPI, before you scale anything.
This also connects to onboarding. A weak retention cohort sometimes isn't a creative problem at all — it's that the install promise and the onboarding flow don't match. If the creative sells one outcome and the app's first session delivers something else, no cohort analysis will save you until you fix the first useful moment a new user hits.
Turning cohort data into creator decisions
Once you've got clean cohorts by creative source, the decisions get a lot easier to make and a lot easier to defend internally.
- Kill creative, not just creators. A creator with one strong-retention video and three weak ones shouldn't get dropped entirely — brief them differently next time.
- Reward retention, not just volume. If you pay creators per video or per install, consider a bonus structure tied to day-30 retention bands. It changes what they optimize for when scripting.
- Feed cohort data back into recruiting. When you're vetting new creators, ask for examples of content that historically retained well, not just content that went viral. Viral and retentive are not the same thing — I've written about why actually using the product matters more than follower count in How to Recruit Creators Who Actually Use Your App.
- Compare against organic. If you also run organic creator content, benchmark its retention against paid. Sometimes organic retains dramatically better because the content wasn't optimized purely for CTR — a pattern explored in Organic Creator Content vs App Install Ads: What Converts.
Don't make creative decisions off cohorts smaller than a few hundred installs. Early retention curves on tiny samples swing wildly and you'll kill a perfectly good creative based on noise.
For a wider view of how creator content fits into the entire acquisition funnel — not just the cohort-analysis slice of it — the mobile app marketing with creator content guide is the right starting point if you haven't mapped out your full strategy yet.
The reporting habit that actually sticks
The teams that keep doing this long-term build it into a recurring report, not a one-off audit. Every two weeks, pull the top 15 creatives by spend, show day-7 and day-30 retention side by side with CPI, and flag anything where retention rank and CPI rank are inverted — meaning the cheap stuff is also the leaky stuff.
Put it in front of whoever approves creative budget. Once a team sees retention cohorts next to spend for a month or two, blended CPI stops being the only number anyone cares about. That shift alone is usually worth more than any single creative swap.
Tools like Amplitude's cohort documentation and AppsFlyer's attribution guides are a good technical starting point if you're building this pipeline from scratch — see Amplitude's guide to retention analysis, AppsFlyer's attribution documentation, and Mixpanel's cohort analysis docs for the mechanics of joining install and retention data correctly.
FAQ
Frequently Asked Questions
What is app retention cohort analysis?
Why segment retention cohorts by creator or creative instead of just campaign?
What tools do I need to run this analysis?
How many installs do I need before trusting a cohort?
Is day-7 or day-30 retention more important for judging creative quality?
Can cheap CPI creative still be a bad investment?
Related reading
- Mobile app marketing with creator content: the full guide
- App Marketing Audience Testing: Test Problems, Not Ads
- How to Recruit Creators Who Actually Use Your App
- Installs vs Activation: Reading Your App Acquisition Funnel
- Organic Creator Content vs App Install Ads: What Converts
- App Trial Conversion Rate: Tracking Creator Campaign ROI