Play Rate Isn't Signups: Landing Page Conversion Rate Guide
High play rate but flat signups? Learn why landing page conversion rate optimization means tracking qualified conversion, not video plays.

Three weeks ago a founder messaged me genuinely excited. His landing page video had a 61% play rate. Best he'd ever seen. Then he asked why trial signups hadn't moved at all that month. That's the moment I knew we needed to talk about landing page conversion rate optimization the right way, because he was optimizing for the wrong number.
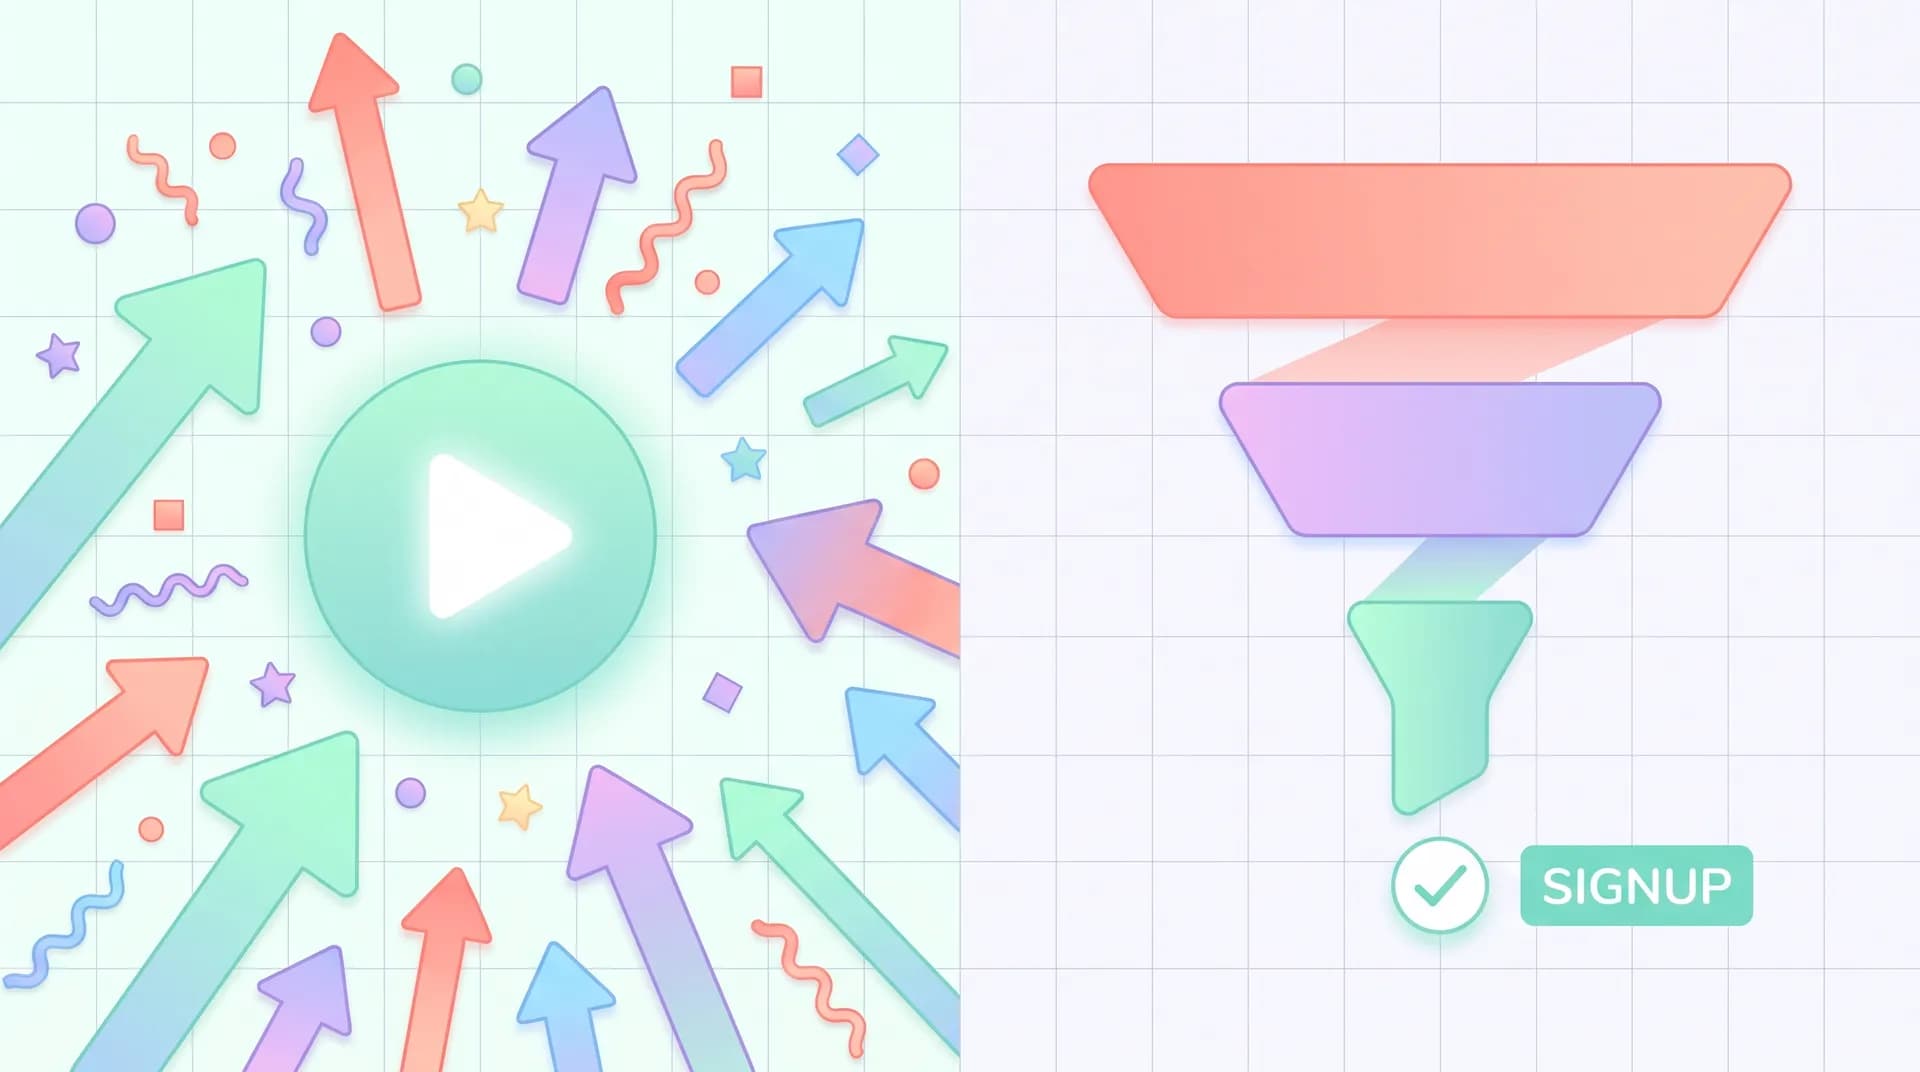
Play rate feels good. It's the metric that shows up first in your video host's dashboard, it's easy to screenshot for a Slack update, and it goes up when you do almost anything — shorter thumbnail text, autoplay, a face in frame. None of that means anyone is closer to becoming a customer.
I've watched this happen at Flare with our own customers more times than I can count. A team ships a slick new hero video, play rate jumps from 30% to 55%, everyone high-fives in the standup. Then four weeks later, qualified trial signups are flat or even down slightly. The video didn't fail. The team just measured the wrong layer of the funnel.
Why Play Rate Is a Vanity Metric for Landing Page Conversion Rate Optimization
Play rate tells you one thing: a visitor was curious enough to click. That's it. It doesn't tell you whether they watched 3 seconds or 90. It doesn't tell you if they understood what your product does. It definitely doesn't tell you if they trusted it enough to hand over an email address.
Think about what actually drives play rate up in isolation:
- A thumbnail with a human face (people click faces, always have)
- Autoplay on scroll, which inflates "plays" without any real intent
- A shorter, punchier opening frame that grabs attention but promises less
Every one of those can boost play rate while doing nothing — or actively hurting — your qualified signup conversion. I've seen autoplay specifically backfire: plays go up because the video just starts, but completion rate and signup rate both drop because people weren't ready to watch and get annoyed enough to bounce. We covered this exact tension in our landing page video thumbnail piece — the frame that gets the most clicks isn't always the frame that gets the most qualified ones.
If your play rate went up after a redesign but pipeline didn't move in the following 2-3 weeks, don't celebrate yet. Check completion rate and signup rate from video-watchers specifically before you call it a win.
The Metric Hierarchy Nobody Talks About
Here's how I think about it internally, in order of how much it actually matters to revenue:
- Play rate — did they click play? (weak signal)
- Completion rate — did they watch past 75%? (moderate signal)
- Post-video CTA click rate — did they act right after? (strong signal)
- Qualified signup/demo conversion — did they fill the right form, with a real work email, and actually show up? (the only number that pays rent)
Most teams I talk to only track #1. A handful track #1 and #3. Almost nobody segments signups by "watched video vs. didn't watch video" to see if the video is pulling its weight at all. That segmentation is the single highest-leverage thing you can add to your analytics this week, and it costs nothing — it's just a filter on data you already collect.
What "Qualified" Actually Means (And Why Raw Signups Lie Too)
Raw signup count has its own vanity problem. I've seen landing pages that generate tons of signups because the CTA says "Start Free" with zero friction and zero qualification — then 80% of those signups never activate because they were never a fit in the first place.

Qualified conversion means the signup matches your ideal customer profile close enough to be worth a sales or success team's time. For most B2B SaaS companies that means:
- Work email domain, not a Gmail or Yahoo address
- Company size or role self-reported (even a single dropdown field helps)
- Completed at least one meaningful activation step within 7 days
If you're running demo request forms instead of self-serve trials, the same logic applies but even more strictly — a demo booked by someone who ghosts the call isn't a conversion, it's a calendar slot you wasted. We go deeper on choosing between these two paths in Trial Signup vs Demo Request, which matters a lot here because the "right" downstream metric depends entirely on which CTA you're actually running.
Add one qualifying field to your signup form — role, team size, or use case — even if it slightly lowers raw signup count. A 15% drop in raw signups with a 40% increase in qualified rate is a trade you should take every time.
A Real Example From Our Own Funnel
When we rebuilt our homepage video at Flare, raw play rate actually dropped a bit — from 48% to 41% — because we moved the video lower, below a clearer value prop statement instead of leading with it. Panic-inducing on day one. But qualified trial signups (work email + at least one project created within 48 hours) went up 22% over the next month. The video was now being watched by people who'd already decided we were relevant, not by curious scrollers who bounced right after.
That's the trade nobody wants to make because it looks worse on the surface-level dashboard. I wrote more about where in the page that handoff should happen in Where to Place Video on Your SaaS Landing Page Design — placement changes who watches, and who watches changes what the metric actually means.
How to Set Up Tracking That Actually Reflects Reality
You don't need a fancy attribution stack for this. You need three things wired together correctly.
First, tag video play, 25%, 50%, 75%, and completion events separately in your analytics tool. Most video hosts (Wistia, Vidyard, even a well-configured HTML5 player with GA4 events) support this out of the box. If you're on a generic embed with no event tracking, that's a page-speed and instrumentation problem worth fixing — we covered the speed side of embeds in Landing Page Video Embed Speed.
Second, pass a "watched video" flag into your signup form submission or your CRM record. A simple cookie or session variable set on a completion event works fine. No need for anything exotic.
Third, build one report that splits qualified conversion rate by watched-vs-not-watched. This is the report that ends arguments. If watchers convert to qualified signup at 2x the rate of non-watchers, your video is earning its spot on the page. If the rates are roughly equal, your video is decoration, not sales infrastructure, no matter how good the play rate looks.
According to CXL's research on video landing pages, video can lift conversion meaningfully — but only when message match between the ad, the video, and the page promise stays tight. A high play rate on a mismatched video just surfaces disappointment faster.
This is really the core idea behind our pillar piece, SaaS landing page conversion: matching promise, video, CTA — the video, the headline, and the CTA all have to promise the same outcome, or you get exactly the play-rate-up-signups-flat pattern that started this whole post. Play rate measures curiosity. Qualified signup measures trust. Those are different jobs, and a mismatched video can win the first one while losing the second.
Signs You're Chasing the Wrong Metric
A few patterns I watch for when a client tells me their video "is working":
- Play rate climbed after a redesign, but time-on-page for non-converters also climbed — people are watching and still leaving
- Completion rate is high (>70%) but post-video CTA clicks didn't move — the video entertained without directing anyone anywhere
- Signups went up but your sales team says lead quality dropped — classic symptom of optimizing the top of the funnel at the expense of fit
Any one of these alone isn't damning. Two or more together means you're reporting a number that makes the team feel good without making the business grow. HubSpot's research on video marketing statistics is worth a skim too — it's full of engagement stats that sound impressive in isolation and say nothing about revenue, which is exactly the trap this post is trying to help you avoid.
Never present play rate to a board or investor as a growth metric on its own. Pair it with qualified signup or demo conversion in the same slide, or don't show it at all. A high play rate with flat pipeline growth will get questioned, and it should.
What to Actually Report Instead
Here's the reporting structure I push every SaaS team I advise toward:
- Overall landing page conversion rate (visitors → qualified signups)
- Video play rate, shown only as a secondary diagnostic, never headline
- Conversion rate split by watched vs. not watched
- Completion rate trend, used to catch message-match problems early, not as a success metric on its own
If your copy and your video are telling the same story, you'll usually see watchers convert at a meaningfully higher qualified rate than non-watchers. If they don't, go back and check whether your page copy is even saying the same thing the video says — we unpack that exact mismatch in Landing Page Copywriting for SaaS That Works Without Video, which is useful even if you do use video, because it forces you to ask what the page would need to do without the clip propping it up.
I'd also recommend reading Nielsen Norman Group's research on video usability if you haven't — it's a bit older but the core finding holds up: people scan for information first and only commit to watching when they believe the payoff is worth the time. That belief is built by message match, not by autoplay tricks.
Stop Optimizing the Metric That Makes You Feel Good
Play rate will always be the easiest number to improve and the easiest one to misread. It's not useless — treat it as a diagnostic, not a destination. The question worth asking every single time you ship a landing page change isn't "did more people click play," it's "did more of the right people sign up." Those two questions have different answers more often than most teams realize, and the gap between them is usually where your actual growth is hiding.
Run the watched-vs-not-watched report this week if you don't already have it. It'll tell you more about your landing page in ten minutes than three months of play rate screenshots ever will.
Frequently Asked Questions
What is a good play rate for a SaaS landing page video?
Why did my signups not increase after improving video play rate?
How do I track qualified signups instead of raw signups?
Should I remove video if play rate is low?
What's the difference between completion rate and play rate?
How does landing page conversion rate optimization relate to video metrics?
Related reading
- SaaS landing page conversion: matching promise, video, CTA
- Demo vs Founder vs Testimonial Video Landing Page Picks
- Message Match: Why Your SaaS Landing Page Examples Fail
- Where to Place Video on Your SaaS Landing Page Design
- Trial Signup vs Demo Request: SaaS Landing Page Best Practices
- SaaS Landing Page Optimization: A/B Testing Video and Layout